

The reach, engagement rate, conversions, click through rate, audience growth, and return on investment are the most significant social media statistics that should be included in a marketing report. These metrics indicate that your content is being viewed, it is resonating, it is causing action and it is producing business outcomes. A good report focuses on performance metrics that relate directly to revenue, lead generation or brand growth, as opposed to vanity metrics like raw follower counts.
In the case of Brand in Marketing, it is straightforward: only the data explaining performance, making decisions, and justifying investment are included.
Key Takeaways
- The prevailing purpose of this question is to solve problems and conduct research: marketers desire to learn what metrics are really important.
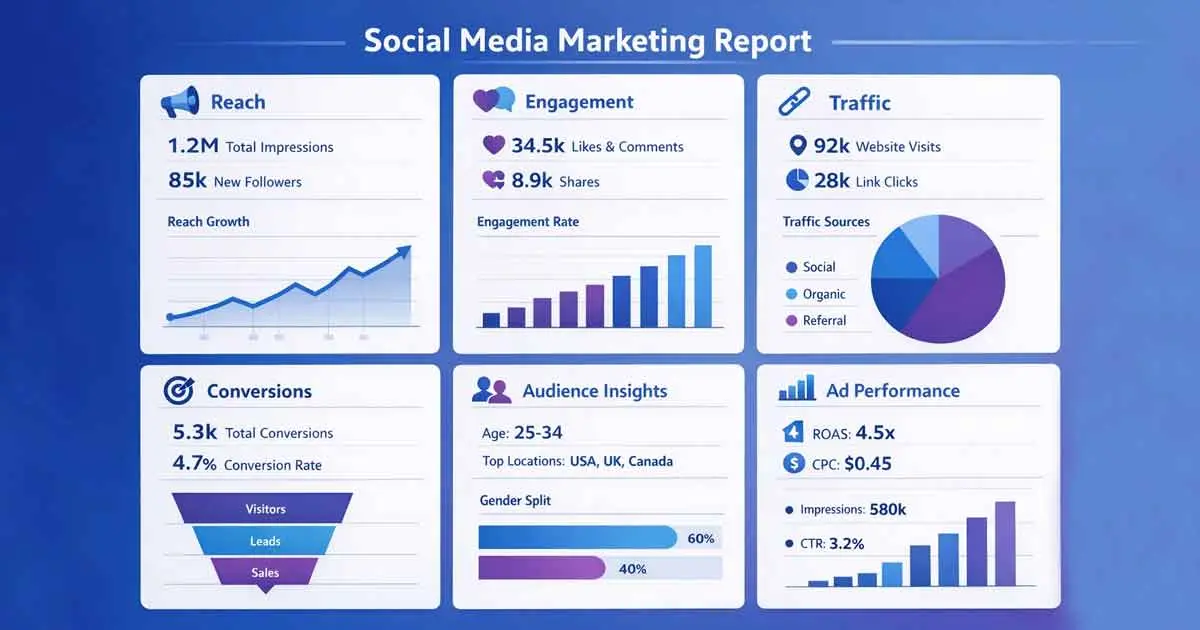
- Any marketing report must include visibility, engagement, traffic, conversions, and ROI.
- The rate of engagement would be more important than the number of likes or followers.
- Leadership level reporting requires conversion metrics.
- The platform data should be related to business results in reports.
- Credibility and decision-making are enhanced through context and benchmarking.
Learning Search Intent: What the Reader Really Needs
The majority of the professionals who put this question together are compiling a monthly, quarterly or campaign report. They do not want the whole list of available metrics. They want to know:
- Which are the most important statistics?
- What measures leadership anticipates.
- How to prioritize data
- How to demonstrate impact
This article will provide the answers to those questions directly and give a framework of developing a credible, decision-oriented marketing report.
Basic Social Media Key Performance Indicators that any Marketing Report should have
1. Reach and Impressions
What It Measures
- Reach: The amount of individual users that viewed your content.
- Impressions: The number of occasions your content was shown.
Why It Matters
These measures are visibility measures. In the absence of reach, no other measure can take place.
The DataReportal Global Digital Overview 2025 shows that social media subscribers are currently more than 5 billion in the world, which is more than 60 percent of the total population of the world. Reach is an important indicator of the market exposure that is made meaningful by this scale.
When to Emphasize It
- Brand awareness campaigns
- Product launches
- Market expansion efforts
Best Practice
Reach of reports and expansion of audiences to demonstrate momentum, not exposure.
2. Engagement Rate
What It Measures
The engagement rate usually incorporates:
- Likes
- Comments
- Shares
- Saves
- Reactions
The engagement rate is calculated as:
|
Formula |
Description |
|
(Total Engagements ÷ Total Reach) × 100 |
Most accurate method |
|
(Total Engagements ÷ Total Followers) × 100 |
Simpler but less precise |
Why It Matters
The relevance and content quality are expressed in engagement rate. A high number of people who are not engaging would mean weak resonance.
According to the Pew Research Center Social Media Fact Sheet, the patterns of platform usage differ greatly according to age and demographic. This implies that engagement benchmarks are not to be generic.
Expert Insight
In his guide to engagement strategy, Neil Patel, digital marketing expert and co-founder of NP Digital, writes that engagement signals are not only a sign of whether your audience viewed your content but also how much of it they find valuable. His discussion can be found in the online marketing blog by Neil Patel.
When to Emphasize It
- Content strategy reviews
- Community building programs.
- Brand positioning campaigns.
3. Click Through Rate (CTR)
What It Measures
The rate of users that clicked on a link after viewing a post.
CTR Formula
(Number of Clicks/ Number of Impressions) x 100.
Why It Matters
CTR demonstrates the motivation of action by messaging.
A low CTR often signals:
- Weak call to action
- Poor targeting
- Irrelevant messaging
The high CTR indicates that there is a match between the interest of the audience and the content being offered.
When to Emphasize It
- Traffic campaigns
- Lead generation efforts
- Landing page testing
4. Conversion Rate
What It Measures
The proportion of users who follow through on a specific action on clicking.
Examples:
- Form submissions
- Purchases
- Downloads
- Event registrations
Why It Matters
Conversion rate bridges the gap between social media and business.
The HubSpot State of Marketing Report 2024 indicates that when marketers set content measures to revenue targets, they are much more likely to report positive ROI.
Expert Perspective
Avinash Kaushik, an advocate of digital analytics and the author of Web Analytics 2.0, points out that it is results that count, not output. His frameworks, which are released via analytics thought leadership platforms and conferences in the industry, support the need to quantify economic value as opposed to surface activity.
When to Emphasize It
- Executive reporting
- Budget justification
- Campaign evaluation
5. Cost Per Result and Return on Investment (ROI)
What It Measures
|
Metric |
Definition |
|
Cost Per Click (CPC) |
Cost per link click |
|
Cost Per Acquisition (CPA) |
Cost per conversion |
|
Return on Ad Spend (ROAS) |
Revenue divided by ad spend |
|
Marketing ROI |
(Revenue – Cost) ÷ Cost |
Why It Matters
Top management wants financial transparency.
The Gartner CMO Spend Survey is a consistent report of pressure on the marketing executives to show business impact. This is fulfilled by financial measures.
When to Emphasize It
- Paid campaigns
- Budget reviews
- Quarterly executive summaries.
Promoting Metrics That Add Context
Although the key metrics are the basis of decisions, the following are supportive.
Audience Growth Rate
Indicates the growth of your brand with time.
Formula
(New Followers / Starting Followers) 100.
Useful for:
- Influencer campaigns
- Brand awareness strategy
- Market penetration analysis.
Video Completion Rate
Of particular importance since video remains the most popular form of engagement.
Wyzowl State of Video Marketing Report 2024 states that more than 90 percent of marketers believe that video provides a positive ROI to their companies.
Completion rate can be used to evaluate:
- Content quality
- Attention retention
- Creative effectiveness
Share of Voice
Compared with competitors, measures brand mentions.
Valuable for:
- Competitive analysis
- Industry positioning
- Reputation monitoring
Vanity Metrics That Should Be Taken With a Grain of Salt
Other measures are impressive but hardly have any impact on strategy.
|
Metric |
Why It Can Mislead |
|
Total Followers |
Does not mirror interactions and conversions |
|
Total Likes |
Lacks business context |
|
Impressions Alone |
Ineffective |
The number of followers should be reported only with the help of engagement and growth rate.
Designing a Marketing Report at Clarity
An effective report usually has the following structure:
1. Executive Summary
Short summary of the performance and major insights.
2. Goal Alignment
Define state campaign goals.
3. Core Metrics
Reach, engagement, CTR, conversions, ROI.
4. Insights and Analysis
Explain what the data means.
5. Recommendations
Provide specific next steps.
This organization will make the report respond to leadership questions before they are posed.
How to Select Metrics depending on the type of campaign
|
Campaign Goal |
Primary Metrics |
Supporting Metrics |
|
Brand Awareness |
Reach, Impressions |
Audience Growth |
|
Engagement |
Engagement Rate |
Shares, Saves |
|
Lead Generation |
CTR, Conversion Rate |
Cost Per Lead |
|
Sales |
CPA, ROAS |
Conversion Rate |
|
Community Growth |
Audience Growth Rate |
Engagement Rate |
The choice of metrics is objective-based, which eliminates clutter and enhances clarity.
Real-World Example
One B2B technology company had greater posting frequency on LinkedIn but a relative lack of growth in engagement. In the analysis of CTR and conversion rate, Brand in Marketing found that posts created traffic but not form submission.
With the optimization of landing page messaging, and matching ad copy to user intent, conversion rate improved by 27 percent in two quarters. The revelation was not made based on reach or likes, but on conversion tracking and cost per lead.
This explains why all reports should be anchored on outcome metrics.
You also read about previous content: DOGE Software Licenses Audit HUD
Conclusion
The most significant social media statistics to include in a marketing report are the ones that elaborate performance in quantifiable business terms. Reach shows exposure. Engagement shows relevance. CTR shows interest. Conversion rate is action oriented. ROI shows financial value.
In the case of Brand in Marketing, the philosophy is disciplined measurement. A report which is properly prepared will not distract but will highlight measurements that will make decisions. Reporting becomes a strategic tool and not a summary when it is aligned with business objectives.
The second step is to audit your existing reporting structure. Remove vanity metrics. Match every statistic to a set goal. Be clear and concise in presentation. Marketing performance comes with improvement in measurement.
Frequently Asked Questions
1. Which social media measures are most significant to the executives?
The executives are concerned with ROI, cost per acquisition, revenue generated and conversion rate. The visibility and engagement measures are secondary as they give context.
2. What is the frequency of creating social media reports?
Most organizations generate monthly reporting, quarterly reports to be reviewed during the strategic reviews and annual reports to be analyzed on performance.
3. What is the good engagement rate?
Platform and industry benchmarks are different. The engagement is to be compared with the previous performance and the industry-related data sources (the Pew Research Center or platform analytics reports).
4. Will follower counts be important in 2026?
The number of followers is not as important as the engagement and conversions. The rate of growth is more instructive than the size.
5. How do CTR and conversion rate differ?
CTR is a measure of the number of clicks. Conversion rate is a measure of the number of people who take the required action following the clicking.
6. What is the method of proving social media ROI?
Measure revenue or value of lead brought about by social campaigns, deduct total marketing expenditures and compute ROI using standard formula. Web analytics tools should be integrated with platform analytics to enhance accuracy.